Many immunological procedures involve measurements of cell proliferation in response to specific stimuli, e.g., proliferation following antibody crosslinking of a cell surface receptor, proliferation following treatment of cells with certain cytokines or mitogens, etc. (See Cell Stimulation). In the literature prior to 1994, the most common cell proliferation measurement involved adding radioactive deoxythymidine (3H-dT) to proliferating cells followed by DNA isolation and measurements of the radioactivity incorporated into newly synthesized DNA. However, since the publication by Lyons and Parish (1) describing a much easier procedure and more versatile FACS-based method for monitoring cell proliferation, this pro described below has become the proliferation assay of choice.
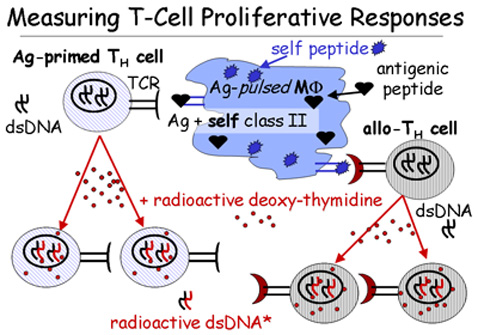
Radiolabeled DNA cell assay of T-cell proliferative Responses.
As illustrated by the figure on the upper right, cell proliferation can be measured and quantified by measuring the amounts of radioactive deoxy-thymidine (3H-dT) that are incorporated into the newly synthesized DNA of cells proliferating in culture. Initially, cells suspended in normal cell culture medium are induced by one mechanism or another to proliferate. After a period of time, the cells are transferred into dT-depleted medium that contains a trace amount of 3H-dT. After another period of incubation, DNA is harvested from these cells and assayed for the incorporation of radioactivity into newly synthesized DNA. As illustrated by the figure below, this method provides a relative quantitative measure of the extent of proliferation because each round of cell division is accompanied by greater levels of radioactive incorporation into genomic DNA.
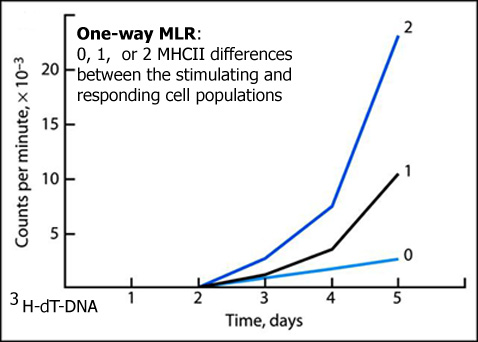
Stimulation of T cell proliferation in a one-way mixed leukocyte reaction (MLR) or mixed leukocyte culture (MLC).
When leukocytes from MHC incompatible individuals are incubated in culture for a few days, the T cells from one individual will proliferate in response to the allo-MHC class I and particularly the allo-MHC class II antigens expressed on the APCs from the other individual, as illustrated by the figure on the top right. Usually a "two-way" MLR ensues because the T cells from both individuals will respond by proliferating to the opposite allo-APCs in the culture. However, the MLR can be rendered "one-way" MLR by first pre-treating one cell population with an anti-mitotic compound, such as mitomycin C, or by irradiating these cells with a high dose of X-rays. Either treatment cross-links genomic DNA and thereby renders cells unable from to proliferate because mitosis is blocked. Nevertheless, cells treated in this way are still able to stimulate the proliferation of untreated allo-T cells, which become the "responder cells" in a one-way MLR. As shown by the figure on the lower right, the "strength" of the MLR response is proportional to the number number of days of culture as well as the number of MHC gene differences between responding and stimulating cells.
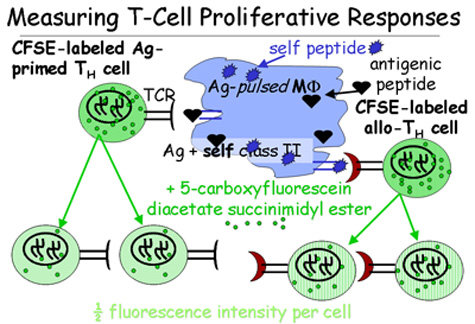
CFSE cell proliferation assay: Green fluorescence measurements of T-cell proliferative responses.
For this method, cells in culture are pre-incubated with (5,6)-carboxyfluorescein diacetate succinimidyl ester (CFSE), which passively diffuses into cells where it is metabolically converted to a highly fluorescent compound that cells retain without apparent effects on metabolism or function (1). As illustrated in the figure below, the fluorescence intensity per cell reduces by about half when a cell divides since the dye redistributes more-or-less equally between the two daughter cells. If cells divide again, the fluorescence intensity divides in half again and so on.
With the fluorescence activated cell sorter (FACS), it is possible to determine how many times a cell population has divided on average over a given time period by counting the number of peaks with diminishing fluorescence starting from right to left where the second peak in from the right counts as one cell division. For example, some of the cells in the sample on the right, after being treated with 2.5 μg/ml PHA for 3 d, have undergone 1, 2, or as many as 3 cell divisions (peak on the far left), whereas some cells have not divided (peak on the far right).
The FACS data in the figure on right (adapted from Fig. 4 of ref. 2) shows the mitotic response of CFSE-labeled mononuclear cells (isolated by density gradient centrifugation) after a 3 d incubation in either (A) culture medium alone (CM) or in culture medium containing varying concentrations of PHA: (B), 1.25; (C) 2.5; or (D) 5.0 μg/ml PHA. The upper histogram in each quadrant represents every cell detected as a dot according to its relative CFSE fluorescence intensity and forward light scattering (FSC). The lower histogram in each quadrant shows the number of "events" or cells detected in the upper histogram according to their relative CFSE fluorescence intensity levels. Note:
This method can easily be adapted for monitoring the proliferation of specific cell populations by tagging them with fluorescently labeled antibodies against specific cell surface markers.
References:
A. B. Lyons and C. R. Parish. Determination of lymphocyte division by flow cytometry. J. Immunol. Meth. 171:131-7 (1994).
A. B. Lyons. Analyzing cell division in vivo and in vitro using flow cytometric measurement of CFSE dye dilution. J. Immunol. Meth. 243:147-54 (2000).