|
|||||||||||||||||||||||||||||||||||||||
|
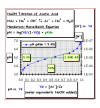
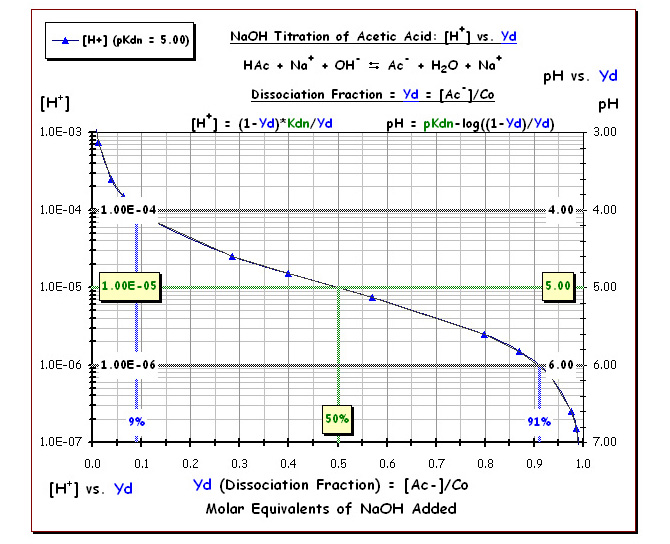
Roll mouse over links at left to view static
images below of different acetic acid titration plots, or click on
the links to open dynamic popup charts.
|
||||||||||||||||||||||||||||||||||||||
|
|
|||||||||||||||||||||||||||||||||||||||
|
|||||||||||||||||||||||||||||||||||||||
|
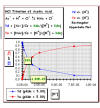
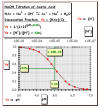
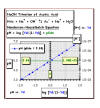
Roll mouse over links at left to view static
images below of different acetic acid titration plots, or click on
the links to open dynamic popup charts.
|
||||||||||||||||||||||||||||||||||||||
|
|
|||||||||||||||||||||||||||||||||||||||
|
|
Top |
|
|
Go back |
| © |
Duane W.
Sears Revised: October 07, 2010 |