Forward and Side Scattering
 |
 |
 |
 |
See Flow Cytometry and Fluorescence Activated Cell Soring (FACS) (Flash Animations)
See Light Scattering Analysis and Two-color FACS Analysis
Flow cytometrhy and fluorescence activated cell sorting refer to techniques where cells (or particles), as they flow in a stream of liquid droplets through a laser beam, are individually detected according to various prescribed physical characteristics, such as light scattering and fluorescence emission.
Bascialy, these measurements are possible only if the cells in the sample are not clumped or not aggregated, and only if the sample is very dilute. The sample is first forced to pass through a narrow orifice, which separates the liquid stream into a series of small droplets. If the sample is sufficiently dilute, most of the droplets will by "empty" (i.e., contain no cells). Most of the droplets that do contain cells will likely contain only one cell, again if the sample is sufficiently dilute; such samples are often referred to as "single cell suspensions." When these droplets pass through the laser beam, the individual light properties of the cell within (i.e., its light scattering and/or its fluoresence emission) are measured and recorded. With some instruments, the droplets can be diverted into collection vessels to amass cells with similar characteristics as pre-set by the investigator. For example, cells can be separated according to a pre-set range of light scattering detected and/or the realtive intensity of fluorescent light of a specific color emitted while the cell passed through the laser beam.
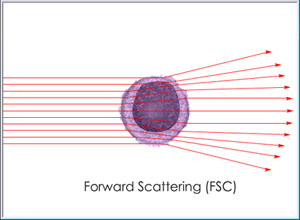
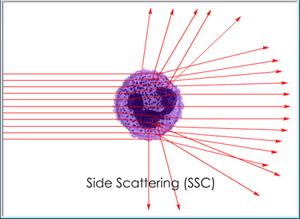
Cells passing through a light beam will scatter light in new directions according to physical size and granularity. The degree of forward scattering (FSC), as measured in a direction slightly off-center from the beam, will vary according to cell size while the degree of side scattering (SSC), as measured in a direction perpendicular to the beam, will vary according to cell granularity.
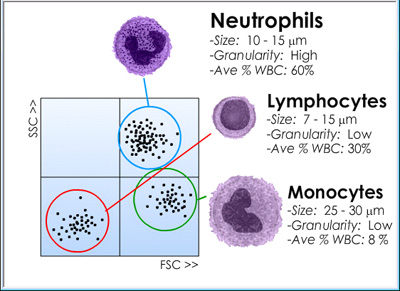 |
As illustrated at the right, different classes of white blood cells (WBCs) effectively exhibit distinct light scattering properties. For example, granulocytes -- including neutrophils, eosinophils, and basophils -- all generate the strongest SSC signals because of their dense cytoplasmic granularity while monocytes generate slightly stronger FSC signals because of their larger average size. Finally, lymphocytes only generate modest SCC and FSC signals because they are mostly non-granular and relatively small. Investigators can analyze these different cell populations separately by setting the FACS instrument up electronically so as to "gate in " or "gate out" cells according to pre-set ranges of light scattering. Flow cytometry and FACS data are often represented by histograms with dots recorded for each cell according to its individual characteristics as measured when it was detected in the laser beam. |
|
Fluorescence Activated Cell Sorting (FACS)
|
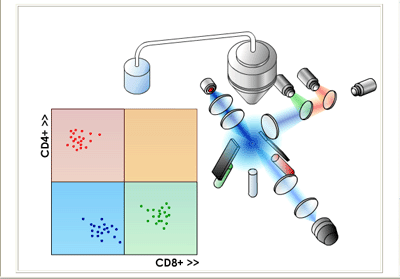
CD4 and CD8 Two-color FACS Analysis of Blood-borne T Cells | |
 |
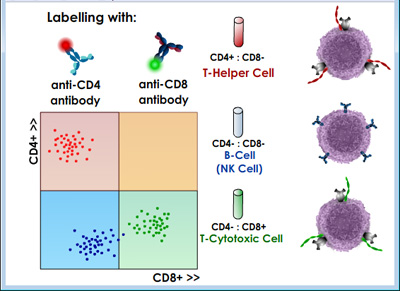 |
For the CD4/CD8 sorting example described above, the resulting histogram might look something like those shown in the figures above where each dot represents a single cell. Different populations of lymphocytes are plotted according to their relative green and red fluorescence intensities. In this way, two "single-positive" (SP) cell populations and one "double-negative" (DN) cell population are found. Further analysis reveals that SP CD4+CD8- cells are mainly comprised of T helper lymphocytes; SP CD4-D8+ are mainly comprised of T cytotoxic lymphocytes; DN CD4-CD8- cells are mainly comprised of natural killer (NK) cells plus antibody-expressing B cells. Clearly, few "double-positive" (DP) cells are found in this analysis, which is not too surprising since CD4+CD8+ lymphocytes are mainly found in the thymus as immature T cells and are rarely found in the blood except in some rare disease conditions. |