Show me
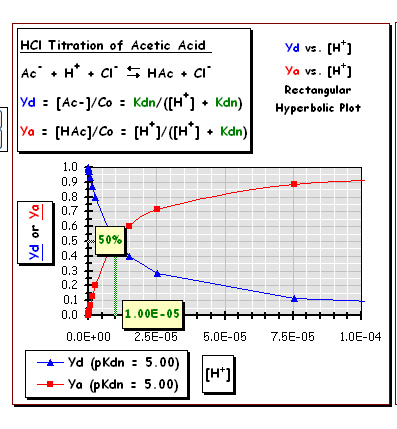
Yd or Ya vs. [H+] (linear scale)
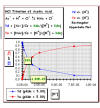
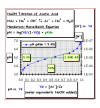
pH Saturation Plot
Ya vs. pH
Ya vs. pH
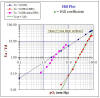
r / [L] vs. r
r = n * Ya = the average number of ligand molecules bound to a receptor with r ligand binding sites

Yd vs. [H+] (log scale)
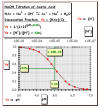
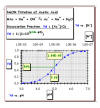
Base Titration Plot
pH vs. Yd
log (Ya / Yd ) vs. log [L]
Yd vs. pH
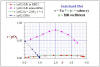
Henderson-Hasselbalch Plot
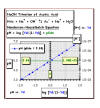
pH vs. log (Yd/Ya)
= log (Yd/(1-Yd))
pH vs. log (Yd/Ya)
= log (Yd/(1-Yd))
Vo / Vmax
vs. [S]
Vmax = the initial reaction velocity
Vo/ Vmax is mathematically equivalent to Ya
Vmax = the initial reaction velocity
Vo/ Vmax is mathematically equivalent to Ya