Reading and Interpreting Numbers
on Logarithmic Axes |
|
When data is plotted on logarithmic
scales, the numbers are typically represented with one of two formats.
- When plotting a set of numbers represented exponentially by factors multiplied by powers of 10, the numbers can be plotted on a logarithmic axis with major axis intervals corresponding to powers of 10 (e.g. 0.1 or 1 x 10⁻¹; 1 or 1.0 x 100; 10.0 or 1 x 101; etc.) and with minor axis intervals corresponding to 1/10th, 2/10th, etc. from left to right of the major axis intervalsl (e.g. 0.2 ,0.3, etc. between major interval 0.1 and 1.0).

- When plotting the a set of numbers represented by their raw logarithmic values on a linear axis with the major axis intervals corresponding to the powers of base 10 (e.g. Log (10-1) = -1.0; Log 100 = 0.0; Log 101 = 1.0; etc.) and the minor axis intervals correponding to 1/10th, 2/10th, etc. from left to right of the major axis intervals (e.g. -0.9 ,-0.8, etc. between major interval -1.0 and 0.0).

The two scales above cover an identical range of numbers but differ in their utility as
illustrated below by the two representations
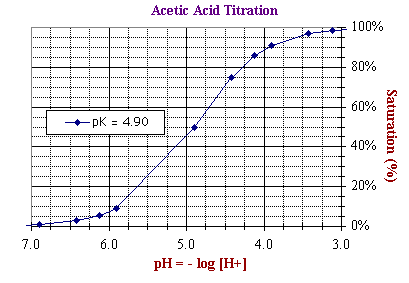
of the titration curve of acetic acid.
When data is plotted
on a log axis, each data point or axis corresponds to an exponential number of base 10
( e.g., 1.0 x 10⁻⁷; 1 x 10⁻⁶; etc.,
in listing the major axes from left to right).
When the logarithmic values of the data points or the axes are plotted on a linear
axis, each data point or axis corresponds to a raw logarithmic value (e.g., 7.0 correponds to the -log (10-7); etc).
Both graphs represent exactly the same data.
In other words, they are there quantitatively equivalent. However, the different formats provide easy access to different types of information about the titration. For example:
- By using the top plot, [H+]
can be read
directly from the X-axis; for example, at 45% saturation, [H+]
= 1.0 x 10⁻⁵.
- By using this bottom plot, [H+]
must be calculated by taking the antilog of the negative
value of the log value read from the X-axis; for example, at 45% saturation, [H+] =
antilog (-5.0) = 10-5.
- In contrast, the bottom plot is easier
use for determining the pKd of acetic acid, defined as the negative
log of the dissociation constant, or -log ([H+]50%)
with [H+] at Ya = 50% saturation. As read directly from the X-axis of the bottom plot, pKdn = 4.90,
where Ya =
50% saturation.
- With the top plot, the value read for [H+]
at 50% saturation from the X-axis -- i.e., 1.25 x 10⁻⁵ --
must be convert to the negative of its log
value;
i.e., pKdn = - log (1.25 x 10⁻⁵) = -
log (1.25) - log (10-5)
= - log (1.25) + 5
= - log (5/4) + 5 =
- log (5) + log
(4) +
5
= - 0.7 + 2 x 0.3 +
5 = - 0.7 + 0.6
+ 5 = - 0.1 +
5 = 4.9 = pKdn
![Acetic Acid Titration vs. [H+]](../../images/acetic-acid-h.gif)
