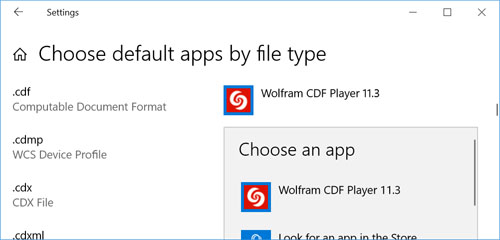
| Download and install the CDF Player: If the lastest version of the Wolfram Mathematica Computable Document Format or CDF player is not already installed on your computer, CLICK HERE to download the CDF Player installation file, install it, and then configure your computer to open "*.CDF" files by defalut with the Player. For example, the image shows how to select the default app setting in Windows 10.
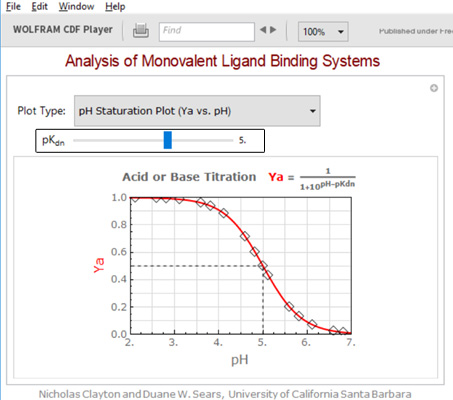
Download and open the CDF activity file: Download the following CDF activity file into a folder you can easily find - Graphical Analysis of Ligand Binding Systems v5[source].MASTER-header.cdf - and then open it with the stand-alone CDF Player. Nested titration plots: As illustrated by the static image on the below (left), the first nested titration plot that appears is a Ya vs. pH analysis of a simple monovalent acid. Here, the saturation fraction (Ya) of a weak, monovalent acid (like acetic acid) is recorded as a function of the equilibrium pH for a given equilibrium dissociation constant (pKdn). |
 |
Note that the equilibrium dissociation constant (pKdn) can be dynamically adjusted with the horizontal slider as outlined black by the rectangle on this image. |
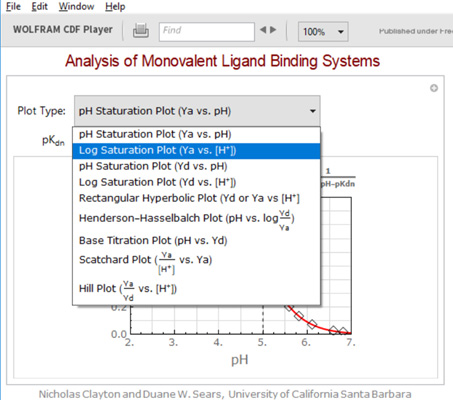
As illustrated by the static image below (right), a pulldown menu can be used to navigate to other nested plots in this file where the same data is plotted according to combinations of different "X" and/or "Y" variables. |
 |
 |
Nicholas Clayton and Duane W. Sears (c) 2011, University of California Santa Barbara.